

Markets and economic developments in 2023 validated our investment approach, as we generated good absolute and risk-adjusted returns for our clients, whilst we learnt some investment lessons from the big surprises to our expectations.
Inflation broadly declined, central banks kept on hiking rates, the US economy surprised positively on the growth side, equity markets rallied and fixed income had a very positive year.
Francesco Mandalà, Chief Investment Officer
Patrick Quensel, Head Investment Advisory

2023 Year in Review
Q1 2023: macro concerns and banks' turmoil
As January began, concerns about a recession were prominent after the market losses of 2022. Both prints for the ISM services and manufacturing in the US were below the 50-mark for the first time since May 2020. After that brief wobble, the growth picture looked more promising as also European natural gas prices dropped 25% in January and 19% in February. With growth coming in stronger than expected, February once again saw growing concerns about more persistent inflation. In particular, after the US CPI data from late 2022 was revised upwards, there was growing talk about a ‘no landing’ scenario. At the start of March, Fed Chair Powell highlighted in his semi-annual congressional testimony that “we would be prepared to increase the pace of rate hikes”, which eventually opened the door to larger 50bp hikes. Turkey and Syria were hit by earthquakes and mobilized the international community in an uncommon humanitarian response. All changed swiftly in March with the collapse of SVB, which raised fears about broader financial contagion. For instance, yields on the 2-year treasuries saw their largest daily decline since 1982, surpassing the daily moves registered during the GFC, after 9/11 and on Black Monday in 1987. Simultaneously, Credit Suisse came under severe pressure, which culminated in the bank's purchase by UBS that included guarantees from the Swiss government.
Q2 2023: AI debuts and central banks hike rates
In April, one of the biggest stories in 2023 started with the growing excitement about the potential for AI, particularly after Nvidia raised its outlook far above expectations thanks to demand for AI. This meant that the "Magnificent 7" were one of the top equity performers in 2023, with a total return of +107% for the year. Nvidia saw the strongest performance in the S&P 500, with a gain of +239% in 2023, whilst Meta saw a very strong +194% advance. In China, despite the exit from the zero-COVID policy, the growth trajectory looked unpromising for the year.
The news on the economic front continued to be positive, which meant that central banks retained their focus on persistent inflation, contrary to speculation about a pause after the regional banking turmoil. For instance, the Fed hiked again in May, and in June their dot plot still signaled two more rate hikes for 2023. As King Charles and Queen Camilla were crowned in Westminster Abbey on May 6th, the UK economy faced high inflation and potentially a recession.
Q3 2023: "higher for longer" and bonds sell-off
Then in July, the Fed hiked once again, taking rates up to 5.5% - a 22 year high. The ECB hiked its reference rate from 2% at the beginning of the year to 3.5% in June. Indeed, the Fed’s September dot plot saw the 2024 dot move up to its highest yet at 5.1%. Inflationary pressures were still present and oil prices were up by over USD 20 per barrel. This led to the market conviction of rates remaining higher for longer, which eventually led to a major bond selloff in September. On top of that, investors became increasingly focused on budget deficits, especially after Fitch downgraded the US credit rating from AAA to AA+.
Q4 2023: Israel-Hamas war, Mag-7, markets year-end rally
By late-October, that backdrop meant the US 10-year yield surpassed 5% intraday for the first time since 2007. Equities also continued to struggle with the S&P 500 down three consecutive months, for the first time since the pandemic turmoil. In addition, European data weakened considerably as well with economic growth contracting by -0.1% in Q3. Geopolitical issues were also back in focus around this time with Hamas’ attack on Israel. Markets were concerned this might lead to a broader escalation, and oil prices were up by +7.5% in the week following the attack.
By the end of October, the market narrative swiftly began to turn partially due to several downside inflation surprises. Central banks also began to sound more dovish, and the Fed’s dot plot in December took investors by surprise after it signaled 75bps of rate cuts in 2024. This led to a wave of optimism about a US soft landing, whereby inflation would be back at target levels without a recession, which would allow central banks to cut interest rates.
All that led to a major cross-asset rally, and November marked the best month for the Bloomberg’s global bond aggregate since December 2008 with a +5.0% return. This trend continued in December with a +4.2% gain, and the index ended the year up +5.7% in total return terms. That was a big turnaround from the situation by the end of October, when it had looked like bonds were set for a third consecutive annual decline. For equities, there was also a very strong year-end rally, and the S&P 500 saw its fastest advance since it rebounded following the initial Covid selloff. That included a +9.1% gain in November in total return terms, which was then followed up by a +4.5% gain in December, which left the index up +26.3% for the year.
However, following the strong year in 2023, the S&P 500 is only up +3% in two years and the Nasdaq is still -2% since the end of 2021 despite the recent rally. The Magnificent 7 are up +9% in two years, but TSLA, AMZN, and GOOGL remain under water since 2021. Long-term Treasuries eked out gains in 2023 (+3%), but remain the worst performing asset class in two years (-26%). Investment-grade corporate bonds also gained 8% in 2023 but are still down 8% in two years. The biggest beneficiaries since the hiking cycle began are gold (+15%) and USD cash (+7%).
Patrick Quensel, Head Investment Advisory
MBaer Investment Approach
Our investment philosophy is achieving long-term performance by following a "risk-first" principlea nd by pursuing a factor investing approach.
The factor investing approach combines top-down macroeconomic views with equity factors such as value, quality, momentum and low volatility, which have historically achieved above-benchmark performance.
Performance and current positioning
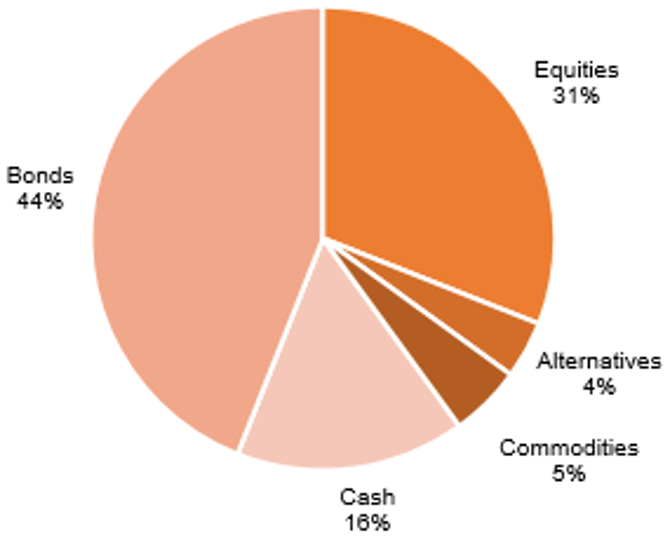
As 2023 came to an end, we reflect on the investment decisions and performance of our mandates across the key economic and markets events of the past year. Despite economic uncertainty, central banks restrictive policies, continuation of the Russia-Ukraine conflict, the beginning of the Israel-Hamas war and on the positive side, supported by the rise of generative AI, markets generated very healthy returns. Overall, we generated good absolute and risk-adjusted returns for our clients in 2023, whilst we learnt some investment lessons from the big surprises to our expectations. The current cautious asset allocation (see Chart 1) reflects our 'risk-first' principle, in that we remain broadly cautious across the mandates' strategies (conservative, balanced, dynamic). From a macroeconomic perspective, we believe that central banks will pivot in 2024 but much less than currently priced in by markets. Our long-term forecasts for the Fed funds rates is that they will fluctuate within the 3.0% to 5.0% range for the next decade.
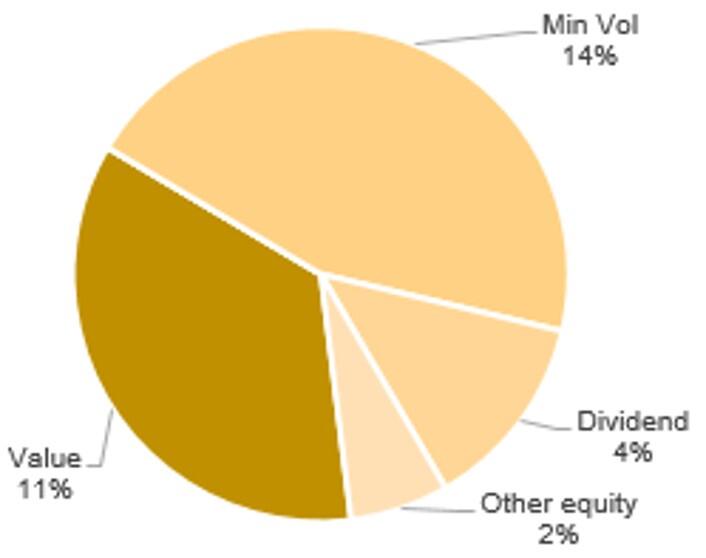
We stay cautious on developed market equities and we are positive on emerging market equities, in general preferring value (relatively cheap assets), minimum volatility (safer assets) and high dividend companies as shown in Chart 1. In fixed income, we increased duration and high quality credit exposure in Q4 last year which strongly contributed to the year performance. We are also invested in short duration high yield and hold a positive view on emerging market local bonds. We maintain an allocation to gold, which strongly contributed to performance last year and commodities. We closed the China equity position early during Q2 last year avoiding the drawdown experienced by the Chinese equity markets.
Chart 1: GIO Balanced portfolio's asset allocation.
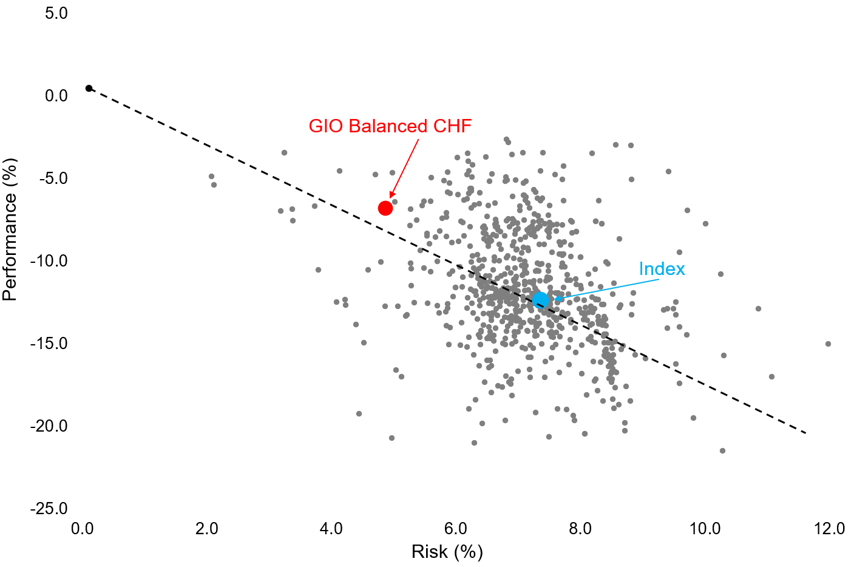
As an illustration of the successful implementation of our investment approach, Chart 2 shows the performance of the portfolio Global Investment Opportunities Balanced in CHF as at end-December 2023, since its inception in July 2021, versus the 732 portfolios monitored by the external company Performance Watcher. Our portfolios strongly outperformed in risk-adjusted terms most of the 732 portfolios and the index (PW mid Risk CHF) assigned by Performance Watcher.
Chart 2 also shows a black dotted line computed by Performance Watcher, which corresponds to the slope of the Sharpe ratio of the benchmark index.
Chart 2: GIO Balanced CHF risk/return profile vs. 732 peers
Francesco Mandalà, Chief Investment Officer
MBaer Factor-Based Asset Allocation
The traditional approach to portfolio construction consists of investments in market-cap-weighted passive and active funds.
Factor investing is somehow between the passive and active investing techniques, targeting specific return drivers (factors) and market betas. The factor strategies typically follow a systematic, rule-based approach and are implemented with low-cost investment vehicles. The factor investment approach is widespread among institutional investors, including family offices, pension funds, insurance companies and Sovereign Wealth Funds (SWFs). As a prominent example, the Norwegian Pension Fund, one of the largest SWFs in the world, pursues a top-down factor investing approach, following the advice of three finance professors - Andrew Ang, William N. Goetzmann and Stephen M. Schaefer. Based on our research, we construct and manage portfolios considering various economic scenarios' impact on the asset classes' returns and risk profiles.
Chart 3 shows risk-adjusted returns (Sharpe ratios) on various asset classes and factors across several macro environments spanning almost a half-century, from 1972 to 2018.
The results in Chart 3 point to the cyclical behavior of traditional asset classes and, second, to the consistent performance of investment factors across the economic cycle.
For instance, equities have higher risk-adjusted returns in environments with rising growth, increasing yields and low volatility. Bonds have risk-adjusted solid returns in low inflation, decreasing interest rates and low volatility environments. Commodities delivered the highest Sharpe ratios in inflationary and accelerating economies. Value, momentum, carry, and low volatility across asset classes show a relatively stable pattern of risk-adjusted returns across all macro environments, suggesting that they are less sensitive to various phases of the macroeconomic cycle.
Chart 3: Asset classes and factors across economic cycles.[1]
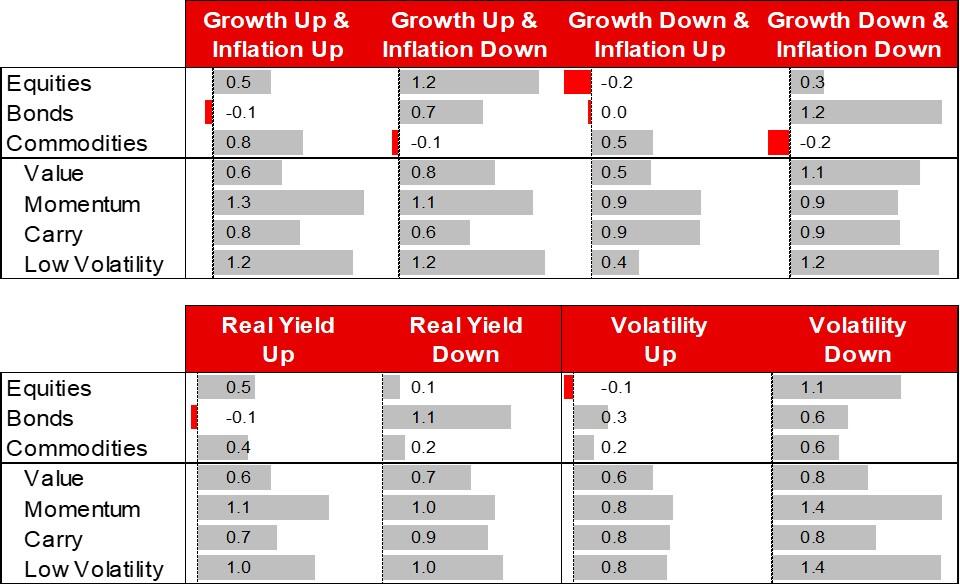
[1] Source: Francesco Mandalà (2020), SFI Master Class "Factor-based Asset Allocation", Antti Illmanen AQR, Chicago Federal Reserve, Bloomberg.
The key insight of our research is that combining top-down macro views and bottom-up factor selection enhances long-term expected returns of our clients' portfolios. This approach provides a more effective diversification of portfolios across a broad range of economic factors.
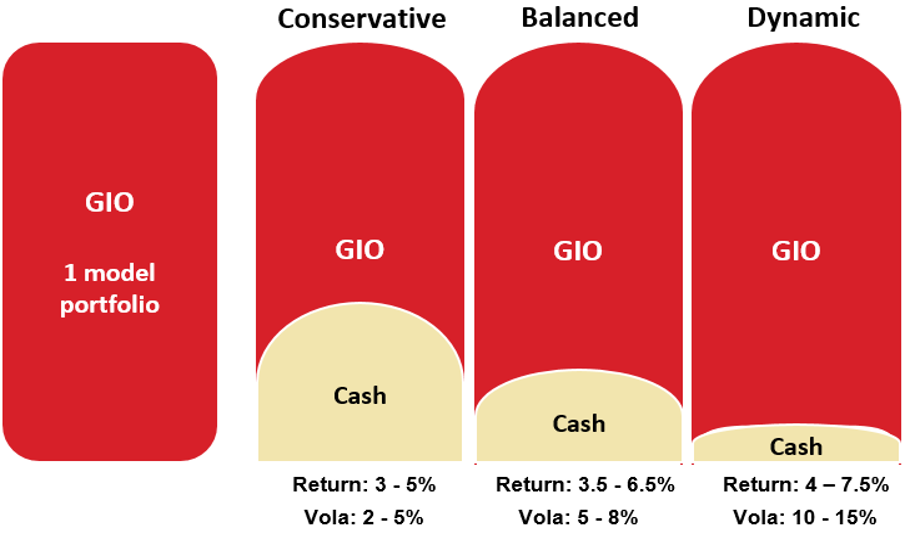
Global Investment Opportunities (GIO) Mandates
The GIO mandates are actively managed multi-asset portfolios built around the principles of equal risk weighting and 'no home bias'. We follow a risk-parity approach, reduce the portfolios' equity beta, and increase the risk of alternative factors and commodities. The problem with the traditional construction of popular mandates, often built around a Strategic Asset Allocation (SAA) of 60% equity and 40% bond, is the dominance of the return profile by the volatility of the portfolio's equity component. By diversifying risks across asset classes and factors, we mitigate the equity concentration risk, lower the equity correlation between equity exposure and economic cycle, and allow more precise measurement and management of the risks in the portfolios. The GIO's objective is to achieve a compelling return with a risk target tailored to the client's risk tolerance. As a measure of risk, we use the historical standard deviation (volatility) of the mandates. We aim to target a low level of volatility for conservative mandates, a medium level for balanced mandates, and a relatively higher level of volatility for dynamic mandates, respectively. Further to our innovative portfolio construction methodology, we believe that investors are better off by investing in a globally diversified portfolio rather than holding a disproportionate share of domestic assets in their portfolio, i.e., following the popular “home bias” advice. Chart 4 shows the core ideas of our investment approach as implemented in the GIO portfolios offered to our clients. The GIO mandate is available in three currencies (Swiss Franc, Euro and US Dollar) and three strategies: Conservative, Balanced and Dynamic. The differentiating characteristic among the three risk profiles is the portion of cash-equivalent securities in each portfolio. For the rest, the portfolio allocations are the same across the three currencies as we hedge the currency exposure at the portfolio level.
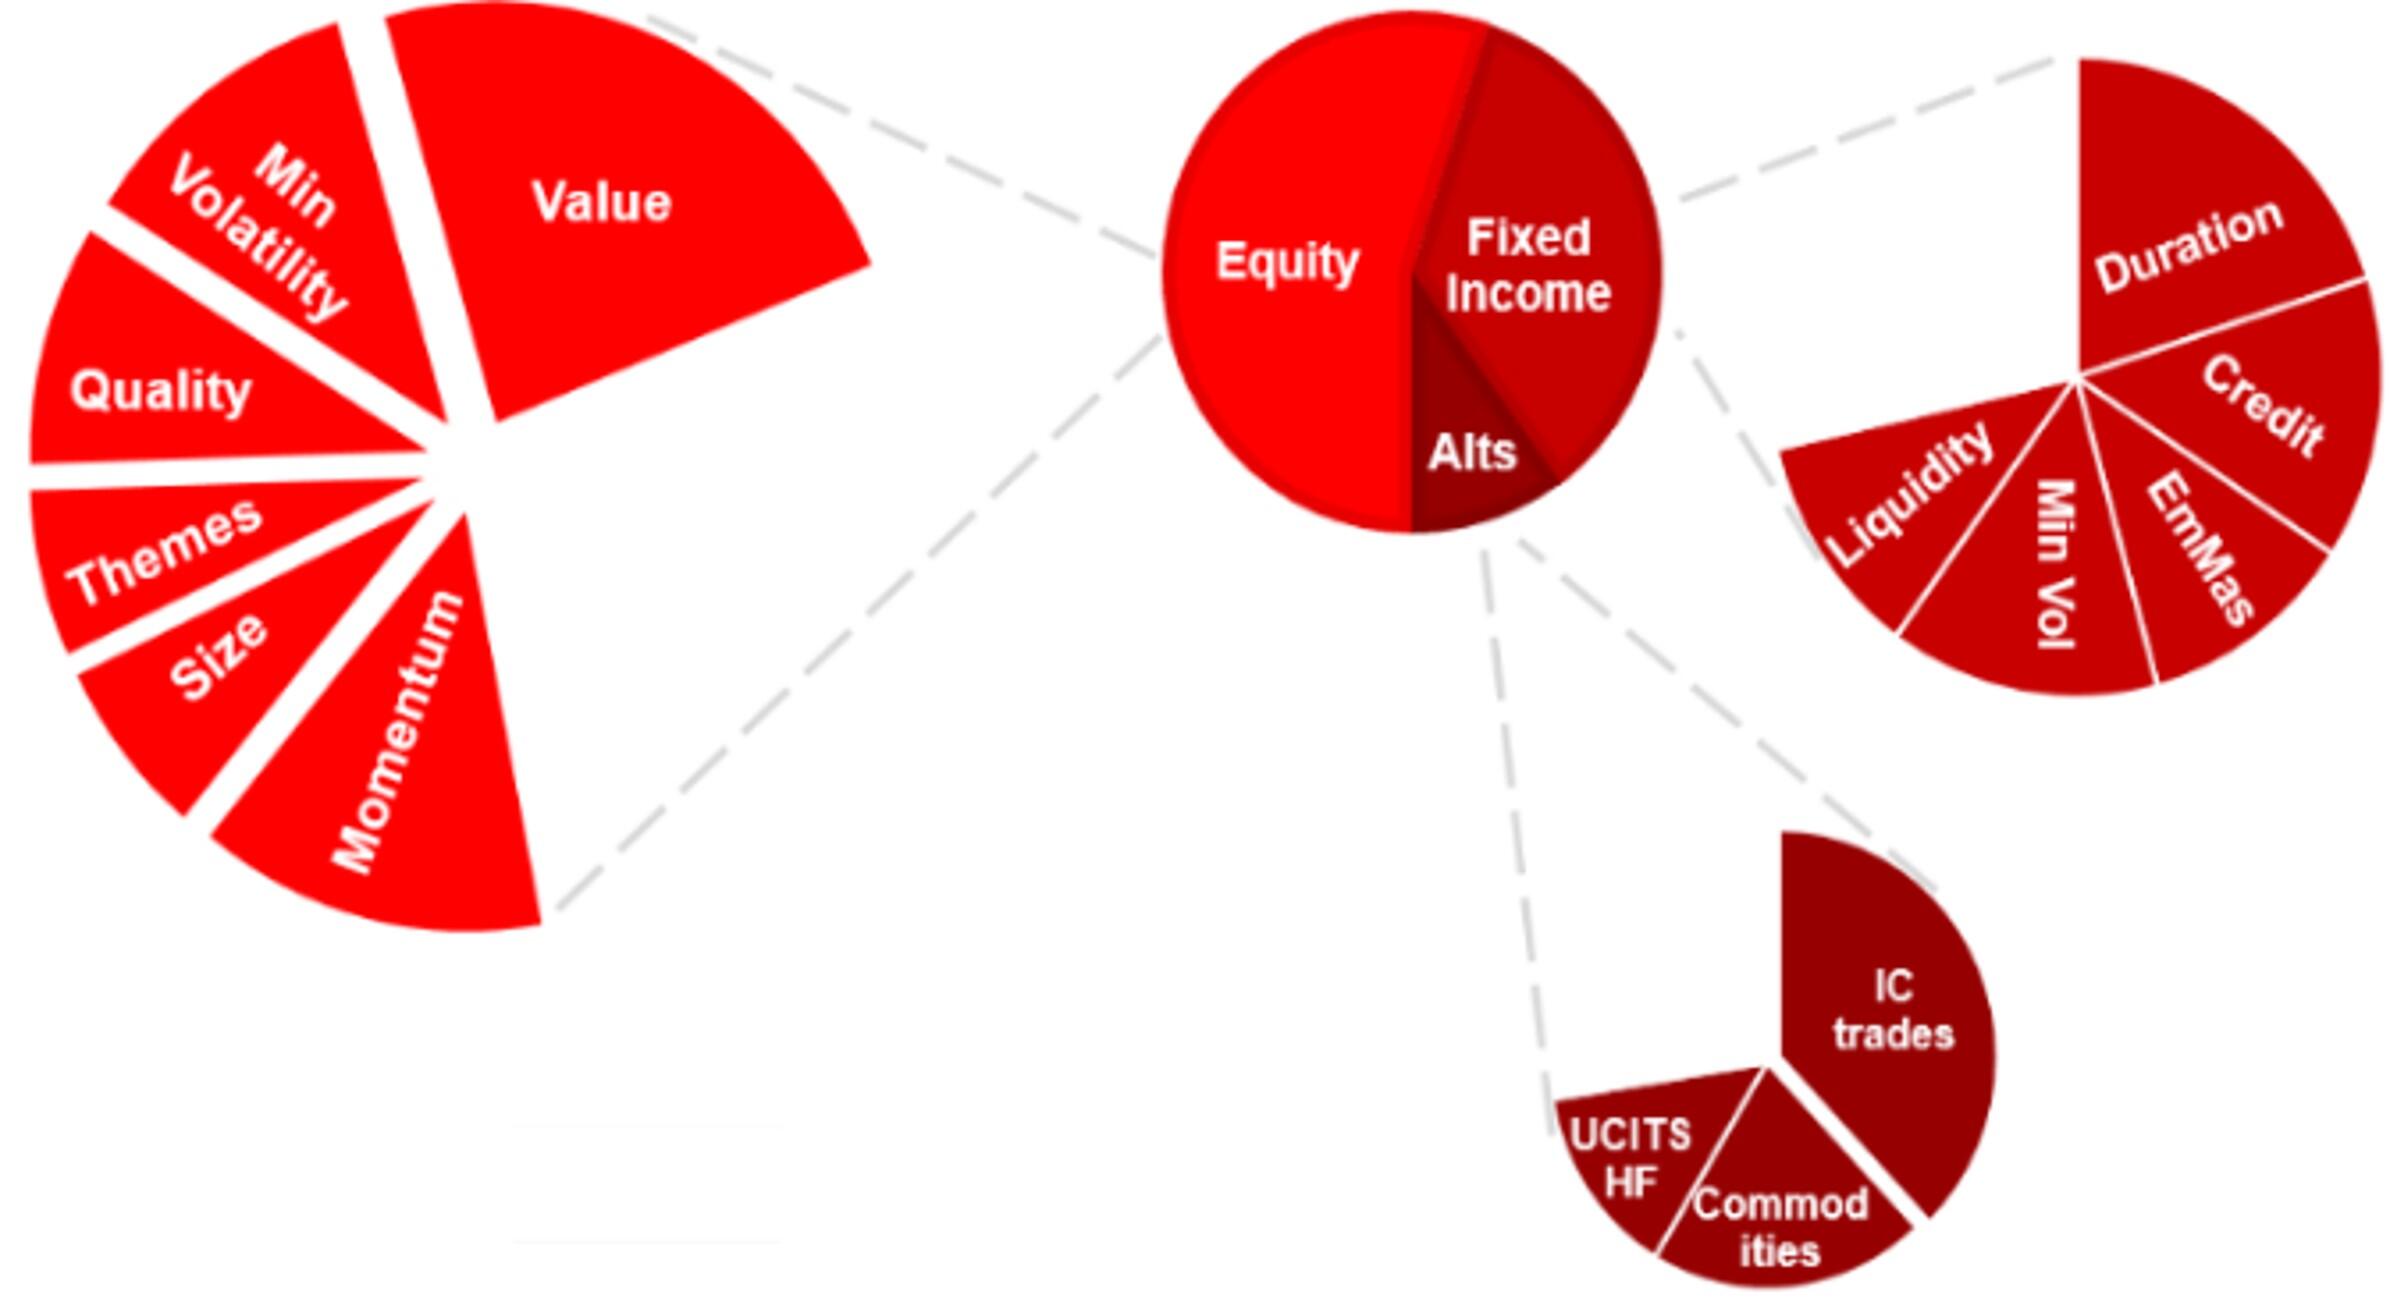
Our GIO mandates combine asset classes and factors across all world regions (see Chart 5), according to the macro and market views of the Investment Committee (IC). As our risk factor-based approach requires a forward-looking macroeconomic view on monetary policy, geopolitical developments, inflation, interest rates, currencies and economic trends, the IC regularly assesses the market and macro conditions and translates its views into portfolio trades.
Chart 5: GIO diversification across asset classes and factors.
We also established a proprietary fund selection process blending qualitative and quantitative analysis of active funds and ETFs, as shown in the Chart 6.
Chart 6: Active funds and ETFs selection process.
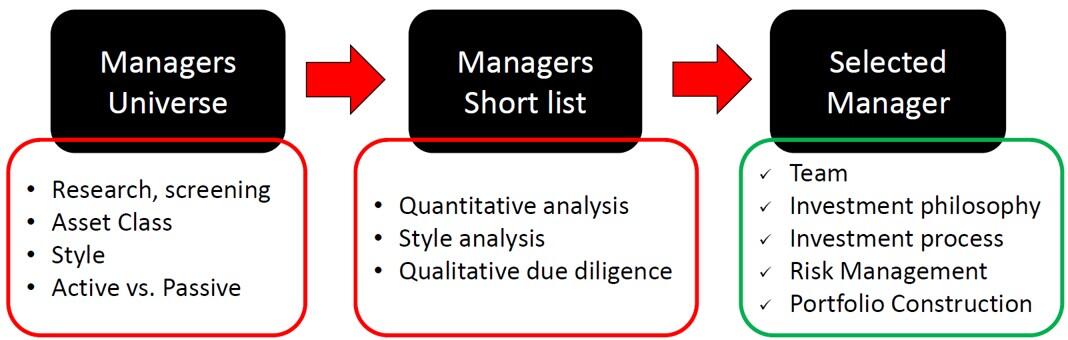
We start from the definition of the managers' universe taking into account the IC's strategic or tactical views, the use of the mutual funds or ETFs in discretionary or advisory portfolios and the specific investment style, which reflects portfolio construction considerations, and, crucially, fees and costs. As a second step, we create a short list based on track-record, fund size, quantitative indicators and performance attribution. Finally, we select the manager taking into account risks and the expected distribution of the fund's returns based on team, philosophy, investment process and current portfolio. Crucially, we believe that economic forecasts help forecasting investment factors performance, which can be used to predict mutual funds’ outperformance, so we sue the economic cycle for factor timing.
Francesco Mandalà, Chief Investment Officer