

In the first quarter of 2024, inflation surprised on the upside, central banks changed narratives, the global economy surprised positively on the growth side, equity markets and commodities rallied and fixed income had a negative performance.

Quarterly Review: Macro and Markets
In the first quarter of 2024, the market conviction of a soft landing for the US economy further increased and became once again the market's dominant theme. This optimistic perception was supported by positive global economic surprises, including the Q4 annualized US GDP growth of +3.4% and the solid growth in the US job market.
In the US, with the ongoing AI-tailwind, the S&P500 returned +10.6% in Q1, slightly ahead of the NASDAQ, and, for the first time since 1971, even scoring 16 positive weeks out of 18. Nvidia continued its winning streak after releasing its earnings report and, with +82.5%, it was again the best performing stock in the index, while the group of Magnificent 7 returned +17.1% in Q1. On the other hand, the laggards were again small-cap stocks with the Russell 2000 up only +5.2%.
In Europe, with a stagnating economy in Q4 last year, the PMIs have started to rise with the flash composite PMI reaching a 9-month high of 49.9 in March. With these cyclical green shoots, the Euro Stoxx 50 even outperformed its US peers with +13% in Q1 - a fact mostly unnoticed by global investors. This performance was driven by a strong banking sector, with UniCredit taking the lead with a return of +43% in Q1.
Whilst global equities followed the Goldilocks narrative (healthy growth and falling inflation), fixed income markets were less optimistic. Skepticism came mainly from upside surprises to US inflation and the oil price recovery of +15% from a low of USD 72 per barrel at the beginning of the year. With mounting concerns about inflation's dynamics, investors raised their inflation expectations, as measured by the US 2-year inflation swaps up by +37bps to 2.42%, the biggest quarterly increase in two years.
The market pushed back the timing of Fed's rate cuts, in line with our expectations. At the start of the year, investors were expecting the Fed to cut rates at the March meeting. By the end of Q1, June was seen as the most likely timing for a first cut. As a result, bond markets weakened, with sovereign bonds closing in negative territory. UK Gilts for instance lost -1.8%, German Bunds -1.5% and US Treasuries -1.0%.
US investment grade bonds weakened by -0.1% during Q1, while EUR investment grade bonds returned +0.4%. Emerging Markets (EM) hard currency and local currency bonds weakened by -1.1% and by -2.2%, respectively.
From a fixed income perspective, credit has offered again a tactical opportunity to add some short-term duration risk after the recent pullback. US investment grade bonds provide an attractive yield of around 5.5%, for instance.
From an equity factor perspective, momentum has outperformed across global markets with US momentum up more than +20% and EU momentum up +14% in Q1, closely followed by US quality with a return of +12%. With an aggregate P/E of 26x, US quality looks more attractive from a valuation perspective than US momentum with a P/E of 40x. Size has been the laggard across regions due to higher refinancing costs and was up a mere +3% and even slightly negative for EM.
During Q1, the Bank of Japan (BoJ) and the Swiss National Bank (SNB) took the center stage.
BoJ hiked rates in March for the first time in 17 years to a range of 0.0% - 0.1%, ending the era of central banks' negative rates. As the market expected a more restrictive monetary policy, the JPY weakened by 6.8% vs the USD in Q1.
The SNB, in contrast, became the first G10 central bank to cut rates in this cycle, with a 25bp policy rate cut to 1.50%. As a result, the CHF weakened 6.6% vs the USD, making it the second-weakest G10 currency in Q1. The US Dollar took the lead among G10 currencies appreciating by 3.6% vs its peers.
As inflation surprised to the upside and the Fed still signaling rate cuts this year, precious metals had a strong quarter. With +9.1%, Gold was marking its strongest monthly performance in March since mid-2020, closing up +8.1% and reaching new all-time highs of USD 2'230 in Q1. Volatile bitcoin returned +85% in Q1 thanks to the launch of SEC-approved bitcoin ETFs. Fed officials speaking over the past weeks were consistent in their message that it is appropriate to wait until there is a clearer indication that inflation is slowing and moving closer to the 2% target before taking the first step of reducing the policy rate.
Outlook
Our baseline scenario has not changed since January. We still expect a recession in the US, decelerating inflation, the Federal Reserve (Fed) to cut rates 3 times (75bps) and quantitative tightening (QT) to continue in 2024. In the Euro area, we expect a recession, lower inflation, the ECB to cut 2-3 times (50-75bps) and QT to continue. As the US economy is expected to enter into a recession and equity valuations are much stretched, the case for an ongoing rally in Q2 gets more uncertain. Europe appears to be rebounding from a low level, amid improving manufacturing, easing financial conditions - we expect the ECB start cutting rates before the Fed - and improving consumer backdrop. Geopolitical risk keep the tail risks elevated and could act as a headwind for risk assets. From a risk-reward perspective, European equities with relatively cheap valuations offer a catch-up potential and with the recent cyclical green shoots, a tactical tilt in favour of European equity still looks attractive. Moreover, if Europe should see as well an uptick in inflation, the quality factor and value sectors like Financials and Energy should continue to outperform.
Performance and current positioning
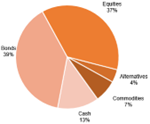
As Q1 2024 ended, we reflect on the investment decisions and performance of our mandates across the key economic and markets events of the past quarter. Despite economic uncertainty, central banks' restrictive policies, continuation of the Russia-Ukraine conflict, the aggravation of the Israel-Hamas war and, on the positive side, supported by the rise of generative AI, markets generated very healthy returns. Overall, we generated good absolute and risk-adjusted returns for our clients in Q1, whilst we learnt some investment lessons from the big surprises to our expectations. In January, we increased exposure to the US growth factor by 6% on average and to commodities by 2% vs short-term bonds and cash equivalents on the basis of our market signals and macro views. The current asset allocation (see Chart 1) reflects our 'risk-first' principle, in that we still remain broadly cautious across the mandates' strategies (conservative, balanced, dynamic). From a macroeconomic perspective, we still believe that central banks will pivot in 2024. Our long-term forecasts for the Fed funds rates is that they will fluctuate within the 3.0% to 5.0% range for the next decade.
We stay cautious on developed market equities and we are positive on EM equities, in general preferring value (relatively cheap assets), minimum volatility (safer assets), growth and high dividend companies as shown in Chart 1. In fixed income, we increased duration and high quality credit exposure in Q4 last year, which strongly contributed to the year performance. We are also invested in short duration high yield and hold a positive view on EM local bonds. We maintain an allocation to gold and commodities, which strongly contributed to performance in Q1. We closed the China equity position early during Q2 last year avoiding the drawdown experienced by the Chinese equity markets and we still maintain that view.
Chart 1: GIO Balanced portfolio's asset allocation.
As an illustration of the successful implementation of our investment approach, Chart 2 shows the performance of the portfolio Global Investment Opportunities Balanced in CHF as at April 2024, since its inception in July 2021, versus the more than 730 portfolios monitored by the external company Performance Watcher.
Our portfolios strongly outperformed in risk-adjusted terms most of the 722 portfolios and the index (PW mid Risk CHF) assigned by Performance Watcher. Chart 2 also shows a black dotted line computed by Performance Watcher, which corresponds to the slope of the Sharpe ratio of the benchmark index.
Chart 2: GIO Balanced CHF risk/return profile vs. 722 peers[1].
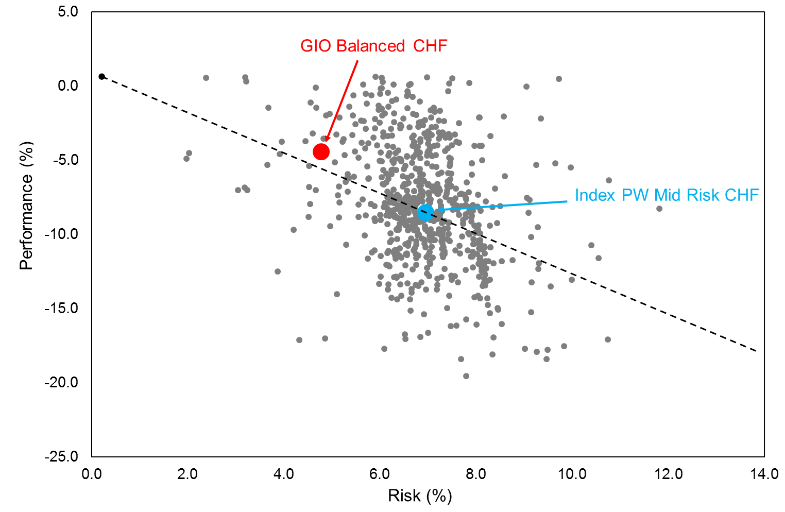
[1] Source: Performance Watcher for the period 1.7.21-10.4.24. Performance shown for illustrative purposes only.
Insights into MBaer Factor-Based Asset Allocation
The traditional approach to portfolio construction consists of investments in market-cap-weighted passive and active funds.
Factor investing is somehow between the passive and active investing techniques, targeting specific return drivers (factors) and market betas. The factor strategies typically follow a systematic, rule-based approach and are implemented with low-cost investment vehicles. The factor investment approach is widespread among institutional investors, including family offices, pension funds, insurance companies and Sovereign Wealth Funds (SWFs). As a prominent example, the Norwegian Pension Fund, one of the largest SWFs in the world, pursues a top-down factor investing approach, following the advice of three finance professors - Andrew Ang, William N. Goetzmann and Stephen M. Schaefer. Based on our research, we construct and manage portfolios considering various economic scenarios' impact on the asset classes' returns and risk profiles.
Chart 3 shows risk-adjusted returns (Sharpe ratios) on various asset classes and factors across several macro environments spanning almost a half-century, from 1972 to 2018.
The results in Chart 3 point to the cyclical behavior of traditional asset classes and, second, to the consistent performance of investment factors across the economic cycle.
For instance, equities have higher risk-adjusted returns in environments with rising growth, increasing yields and low volatility. Bonds have risk-adjusted solid returns in low inflation, decreasing interest rates and low volatility environments. Commodities delivered the highest Sharpe ratios in inflationary and accelerating economies. Value, momentum, carry, and low volatility across asset classes show a relatively stable pattern of risk-adjusted returns across all macro environments, suggesting that they are less sensitive to various phases of the macroeconomic cycle.
Chart 3: Asset classes and factors across economic cycles.[1]
[1] Source: Francesco Mandalà (2020), SFI Master Class "Factor-based Asset Allocation", Antti Illmanen AQR, Chicago Federal Reserve, Bloomberg.
The key insight of our research is that combining top-down macro views and bottom-up factor selection enhances long-term expected returns of our clients' portfolios. This approach provides a more effective diversification of portfolios across a broad range of economic factors.
Global Investment Opportunities (GIO) Mandates
The GIO mandates are actively managed multi-asset portfolios built around the principles of equal risk weighting and 'no home bias'. We follow a risk-parity approach, reduce the portfolios' equity beta, and increase the risk of alternative factors and commodities. The problem with the traditional construction of popular mandates, often built around a Strategic Asset Allocation (SAA) of 60% equity and 40% bond, is the dominance of the return profile by the volatility of the portfolio's equity component. By diversifying risks across asset classes and factors, we mitigate the equity concentration risk, lower the equity correlation between equity exposure and economic cycle, and allow more precise measurement and management of the risks in the portfolios. The GIO's objective is to achieve a compelling return with a risk target tailored to the client's risk tolerance. As a measure of risk, we use the historical standard deviation (volatility) of the mandates. We aim to target a low level of volatility for conservative mandates, a medium level for balanced mandates, and a relatively higher level of volatility for dynamic mandates, respectively. Further to our innovative portfolio construction methodology, we believe that investors are better off by investing in a globally diversified portfolio rather than holding a disproportionate share of domestic assets in their portfolio, i.e. following the popular “home bias” advice. Chart 4 shows the core ideas of our investment approach as implemented in the GIO portfolios offered to our clients. The GIO mandate is available in three currencies (Swiss Franc, Euro and US Dollar) and three strategies: Conservative, Balanced and Dynamic. The differentiating characteristic among the three risk profiles is the portion of cash-equivalent securities in each portfolio. For the rest, the portfolio allocations are the same across the three currencies as we hedge the currency exposure at the portfolio level.
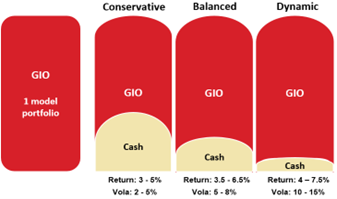
Chart 4: Global Investment Opportunities (GIO).
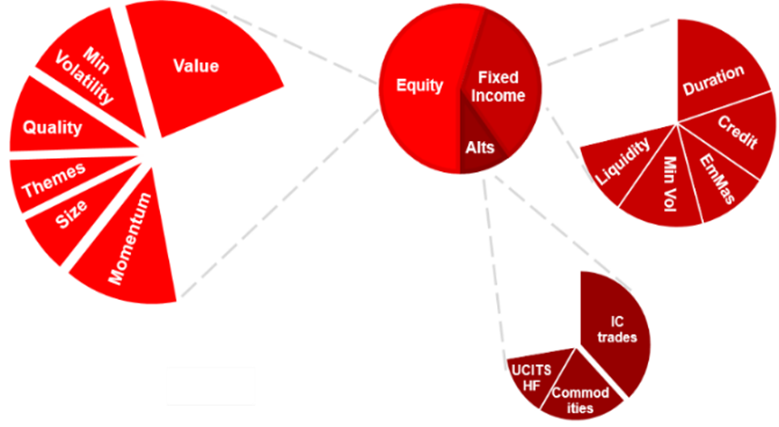
Our GIO mandates combine asset classes and factors across all world regions (see Chart 5), according to the macro and market views of the Investment Committee (IC). As our risk factor-based approach requires a forward-looking macroeconomic view on monetary policy, geopolitical developments, inflation, interest rates, currencies and economic trends, the IC regularly assesses the market and macro conditions and translates its views into portfolio trades.
Chart 5: GIO diversification across asset classes and factors.
We also established a proprietary fund selection process blending qualitative and quantitative analysis of active funds and ETFs, as shown in the Chart 6.
Chart 6: Active funds and ETFs selection process.
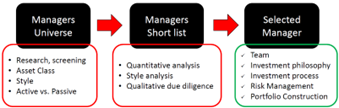
We start from the definition of the managers' universe taking into account the IC's strategic or tactical views, the use of the mutual funds or ETFs in discretionary or advisory portfolios and the specific investment style, which reflects portfolio construction considerations, and, crucially, fees and costs. As a second step, we create a short list based on track-record, fund size, quantitative indicators and performance attribution.
Finally, we select the manager taking into account risks and the expected distribution of the fund's returns based on team, philosophy, investment process and current portfolio. Crucially, we believe that economic forecasts help forecasting investment factors performance, which can be used to predict mutual funds’ outperformance, so we sue the economic cycle for factor timing.
Disclaimer
This document is for information purposes only. It constitutes neither an offer nor a recommendation to purchase, hold or sell financial instruments or banking services, and does not release the recipient from carrying out their assessment. The recipient is recommended to check the information in terms of its compatibility with their circumstances and its legal, regulatory, tax and other consequences, possibly on the advice of a consultant. The data and information contained in this publication were prepared by MBaer Merchant Bank AG with the utmost care. However, MBaer Merchant Bank AG does not assume any liability for the correctness, completeness, reliability or topicality, or any liability for losses resulting from the use of this information. This document may not be reproduced in whole or in part without the written permission of MBaer Merchant Bank AG.
Dieses Dokument dient ausschliesslich Informationszwecken. Es stellt weder ein Angebot noch eine Empfehlung zum Erwerb, Halten oder Verkauf von Finanzinstrumenten oder Bankdienstleistungen dar und entbindet den Empfänger nicht von seiner eigenen Beurteilung. Insbesondere ist dem Empfänger empfohlen, allenfalls unter Beizug eines Beraters, die Informationen in Bezug auf die Vereinbarkeit mit seinen eigenen Verhältnissen, auf juristische, regulatorische, steuerliche, u.a. Konsequenzen zu prüfen. Die in der vorliegenden Publikation enthaltenen Daten und Informationen wurden von der MBaer Merchant Bank AG unter grösster Sorgfalt zusammengestellt. Die MBaer Merchant Bank AG übernimmt jedoch keine Gewähr für deren Korrektheit, Vollständigkeit, Zuverlässigkeit und Aktualität und keine Haftung für Verluste, die aus der Verwendung dieser Informationen entstehen. Dieses Dokument darf weder ganz oder teilweise, ohne die schriftliche Genehmigung der MBaer Merchant Bank AG reproduziert werden.